Take a look at the infographic below to see the trends that shaped the bridging finance market in Q3 2015.
Key Points:
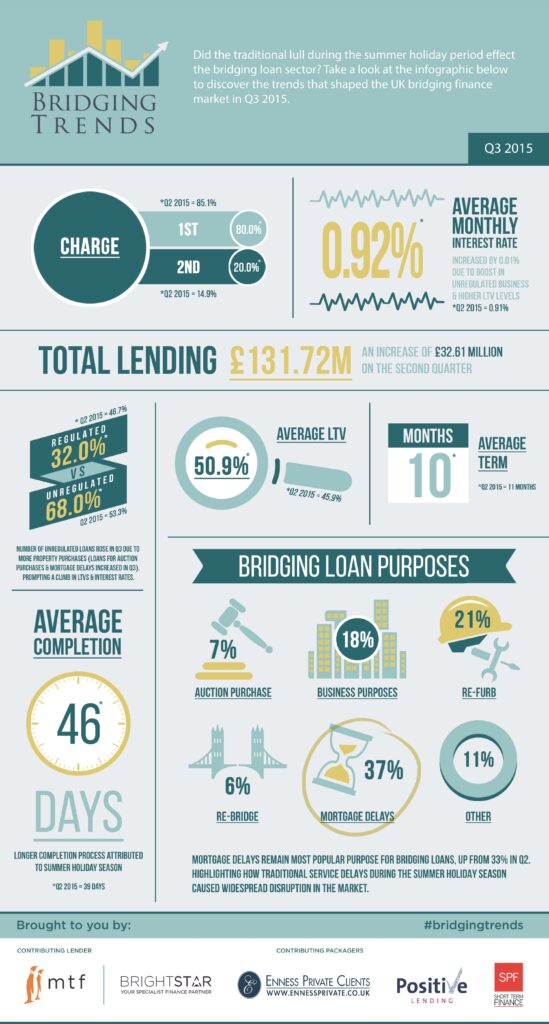
Total contributor lending increased to £131.72m
Average LTV increased to 50.9%
Average monthly interest rate increased to 0.92%
Mortgage delays remains most popular use for bridging loans
Regulated loans dropped to 32%
Average term 10 months
Director’s comments
Joshua Elash, Director at bridging loan lender, MTF:
The recent data is interesting as we are beginning to see a degree of consistency in the key market parameters we are seeking to benchmark.
The percentage of first charge business versus second charge, the average monthly interest rates, average terms, and the LTV data shown in the first three quarterly reports are all sufficiently consistent to begin to give us reliable insight into the bridging finance market.
We are however, surprised to see the average number of days being taken to complete a bridging loan lengthening out further from what already appeared to be a rather extended period of 39 days as per the Q2 results. This may be a seasonal anomaly and we are interested to see how this figure will shift as we move into the final quarter of the year.
Chris Fairfax, Managing Director of Positive Lending:
The bridging market continues to gather pace as a consequence of reduced pricing. These figures clearly demonstrate that bridging finance is being used for a number of purposes but mortgage delays remain most popular, our data would certainly agree with this. I was slightly surprised to see average completions taking 46 days, otherwise the statistics are broadly representative of our bridging business.
Chris Whitney, Head of Specialist Lending at Enness Private Clients:
Total lending up by over a third has got to be the big news. Enness as a small part of that not only saw an increase in volumes but also an increase in loan sizes with the biggest being £12m as a single loan. This just goes to show that bridging isn’t the small ticket business it used to be and now being used by sophisticated real estate professionals and businesses alike.
The sentiment in the market overall feels as though there is a real appetite to gear as high as possible. However the Average LTV in the bridging trends remains surprisingly low. This would seem to fly in the face of critics who often claim bridging is irresponsible lending.
Mortgage delays are certainly an issue as the figures show. I also feel that this isn’t just an issue caused by the summer holidays. The regulators tightening their grip has meant additional underwriting and more onerous processes for clients and their brokers to negotiate making the whole process much slower. Refurbishment loans also still a big part of the business mix as the short term finance market continues to service the space left by some of the main stream development funders.
Kit Thompson, Director of Bridging at Brightstar:
The stand-out figures for me are the quarterly increases in lending volume, which shows that the bridging market is indeed growing and bridging has far from plateaued, as some sceptics predicted it might. Whilst the actual size of the bridging market is unknown with estimate from £2bn to £5bn, one thing we can be sure of is it continues to increase and the sector is in rude health.
Apart from the increase in lending, the Q3 figures are comparative to those reported in Q1 and I would predict that this will remain typical over the whole year. The slight drop in regulated transactions could be attributed to forthcoming MCD regulation, but I feel it is probably too early for this to have any significant affect. If MCD is to have any bearing, then this will show when comparing Q1 and Q2 2016.
The biggest and most disappointing variance has been in the average completion time, which has increased quarter on quarter with the average now at 45 days. This is not a surprise as bridging cases still tend to experience two bottle-necks, which have plagued the industry for some time, namely; valuation delays and legal delays, with the latter being the largest contributor to delayed completions. Lenders need to increase the number of surveyors on their panel to allow for service delays and it has been suggested before, but an expert panel of solicitors who are well versed in dealing with bridging should be made available to borrowers as a choice, rather than their own perhaps inexperienced conveyancer who has never dealt with bridging before.