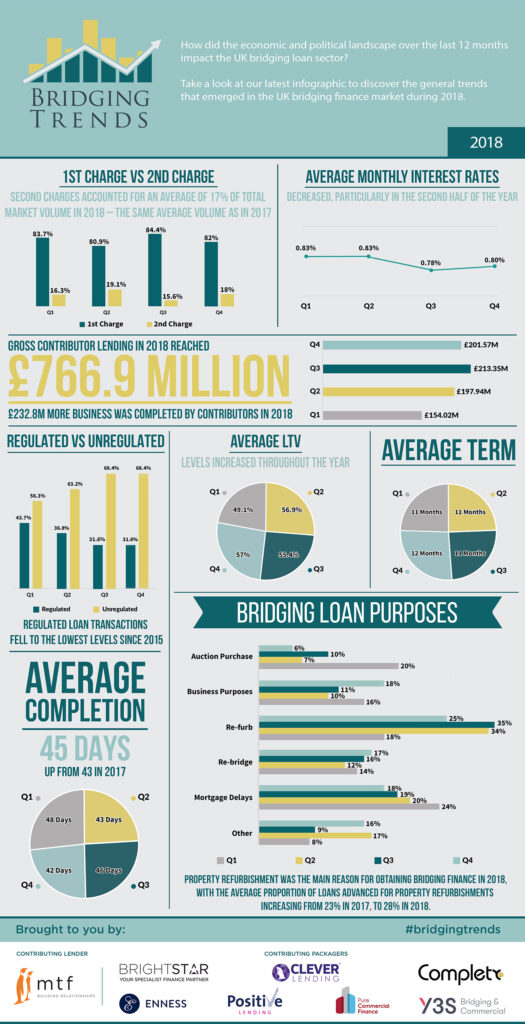
Take a look at the infographic below to see the trends that shaped the bridging finance market in 2018.
Key Points:
Average monthly interest rates continue to fall year-on-year
Regulated bridging loans decreased market share on previous years
2nd charge loans accounted for same market volume as in 2017
Average LTV levels increased in 2018 to an average of 55%

Director’s comments
Gareth Lewis, Commercial Director, MT Finance, comments:
“Investor sentiment is resilient and investing in property to add value and improve returns was evidently a long-term trend throughout 2018. With Brexit still uncertain, the first quarter’s data will be interesting reading, but I expect demand for bridging finance will remain strong and the product will continue to provide vital support for property investors.”
Phil Jay, Director, Complete FS, comments:
“Good to see strong results that reinforce the sector’s essential resilience. Although the bridging market will not be immune to the shockwaves surrounding Brexit, the industry is fortunate to have a broad base of lenders that can currently more than compensate for any likely loss of liquidity, if funding tightens.
“Our lending was up 12% over the year and as we go into 2019, we will be looking to ensure that our lending panel reflects the experience and longevity needed to see out any further blips that might come our way.”
Nathan Raffour, Director, Y3S Bridging & Commercial comments:
“The bridging market has continued to grow, despite challenges we have faced as an industry.
“Our regulated business is higher than the average on the report, and we are also experiencing an increase in demand for refinance for bridging.
“Our forecast for 2019 is very positive, even with Brexit looming.”
Chris Whitney, Head of Specialist Lending, Enness Global Mortgages comments:
“I think the most thought-provoking aspect of this data is the increase in loan volume. Clearly a direct link to the additional contributors but it is still a big number and begs the question exactly how big is the bridging loans market in its entirety and how big could it get? Sadly, I am not sure an accurate figure will be forthcoming any time soon as it’s not an easy question to answer. Some lenders will see their data as commercially sensitive and there will always be ‘off radar’ lenders (i.e. family offices etc) that wouldn’t report any lending at all despite lending significant sums. As the index shows the bulk of the market is unregulated loans so many not required report the numbers.
“This is why I think the bridging ‘trends’ index is a useful barometer of sentiment in the market place and how macroeconomics might be impacting on it.
“I think we will see demand increase this year for second charge loans with some first charge holders having Brexit worries coupled with the fact that as we have seen in this quarters data pricing continues to see downward pressure making it a fast, simple cost-effective solution for many borrowers. It can be particularly attractive for borrowers who have very attractive historic mortgage deals that would not be available now and can’t borrow anymore on that product. Adding on a good second charge loan can give a surprisingly low overall blended rate.
“Whilst the average term came down, I think many ‘bridging’ lenders are offering much longer terms now with a demand for it as cost of funds becomes more and more cost effective so I don’t see that as a trend that will continue. Coupled with the still low average LTV hopefully reflecting continuing responsible lending.”
