Take a look at the infographic below to see the trends that shaped the bridging finance market in Q2 2016.
Key Points:
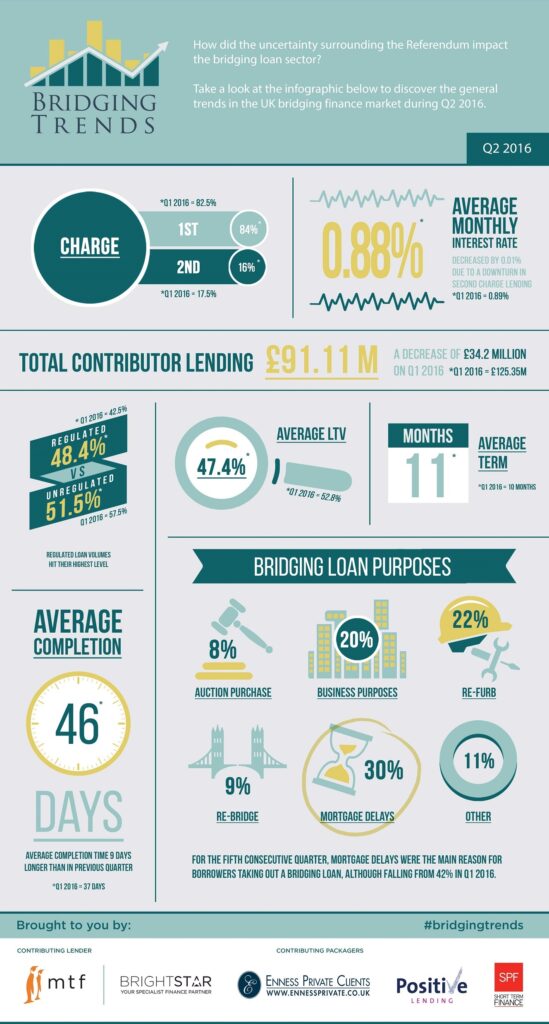
Lending decreased to £91.11m
Average LTV decreased to 47.4%
Mortgage delays most popular use for bridging loans
Regulated loans hit new high
Director’s comments
Joshua Elash, director of bridging finance lender, MTF:
“Uncertainty in the run up to the Referendum seems to have contributed to a cooling off of the market. However, though there was a drop in lending volumes in Q2, the latest data has in fact shown a degree of consistency with the same quarter last year, where lending volumes were only 8% higher at £99.11 million.
“Overall, the sector is in good health. Cheaper rates of interest and lower loan to values continue to show that the bridging market is behaving responsibly.”
Chris Whitney, Head of Specialist Lending at Enness Private Clients:
“I was surprised to see the average completion time increase again to 46 days. Lenders may need a reminder of the old marketing slogan ‘If it’s not done in 2 weeks it’s just not bridging!’ To be fair, this could be down to short-term funders providing facilities for development which is admittedly a longer process.
“Following the surprise Brexit vote, I expect specialist lenders and brokers to come into their own. Demand will be high and, as some lenders withdraw from the arena with funding line issues, it will be interesting to see whether others in the space are ready and willing to meet it.”
Kit Thompson, Director of Bridging & Development at Brightstar Financial:
“It is no surprise that bridging lending was down for Q2 in the lead up to the referendum, with the fall-out of MCD, stamp-duty changes to BTL and of course, the shock Brexit result.
“We have to bear in mind that March was a bumper month for the bridging industry as borrowers wanted to beat the stamp-duty changes, followed by inevitably quieter months in April and May.”