Take a look at the infographic below to see the trends that shaped the bridging finance market in the first quarter of 2017.
Key Points:
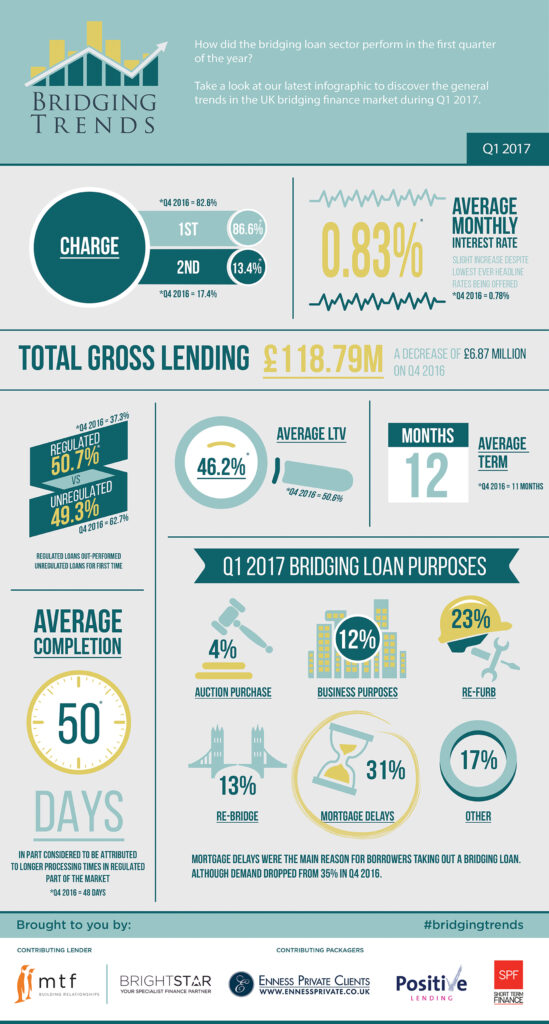
Contributor lending down 5.5% on Q4 2016
Regulated loans outperformed unregulated loans for 1st time
Mortgage delays most popular use for bridging loans
Pricing increased for the first time since Q3 2015
Director’s comments
Joshua Elash, director of bridging finance lender, MTF:
The significant swing towards regulated lending marks an interesting shift which, in turn, we consider has impacted the average time it takes to complete a bridging loan. Also, whilst the level of regulated activity is up it is interesting to see rates increase for the first time in 5 reporting cycles.
Whilst it is too early in the year to draw any firm conclusions from this first quarter of data, it is these key parameters we are most keenly observing as we move forward in the year.
Michael Perry, Bridging Finance Broker at Enness Private Clients:
Q1 2017 appears to have experienced somewhat of a hangover from the financial uncertainty of 2016, with gross lending down to £118.79million from £125.62million since Q4 2016. Additionally, we have seen average monthly interest rates rise from 0.78% to 0.83%, despite the lowest ever headline rates being offered.
In terms of the increased interest rate, we have always said it isn’t the be all and end all; at the end of 2016 we said it would be more beneficial to see greater innovation within the specialist lending sphere, rather than simply keener pricing. The great service vs. rates debate rolls on.
As predicted, it’s no surprise to see the number of regulated loans among specialist lenders increasing in Q1 with various government changes putting pressure on the market to move into the regulated sector. We have been aware for a while of several non-regulated lenders looking to become regulated so this could well be a demonstration of this. Average loan to value remains at modest levels, indicating that the industry is continuing its responsible lending policies.
Finally, the most common reasons for bridging loans being taken – refurbishment and mortgage delays – is certainly something evidenced by our client base as people wish to make a good return on an investment or take advantage of the current market by making an onward purchase.
Kit Thompson, Director of Bridging & Development at Brightstar Financial:
Commenting on the first quarter of 2017, the slight drop in lending I do not see as significant and not a sign of a shrinking market. We just had less completions in Q1, which is supported by the increase in the average completion time to 50 days.
New business enquiries in Q1 were way-up and our business pipe-line of post offer cases is larger than ever. It is the delays in cases paying out that I attribute to this slight drop on the previous quarter.
The delays seem to be twofold; a lack of urgency on the borrower’s part to complete in a hurry and continued delays with legals where borrower’s solicitors tend to drag their heels and take too long to deal with the legals. This seems to be an industry wide issue and one we are trying to address it by offering a panel of experienced bridging lawyers to borrowers, which we help will reduce the average completion times.
The stand-out stat for me is that the percentage of FCA regulated loans out-stripped non-regulated loans for the first time. I would attribute this to a combination of the cheapest rates the sector has ever seen (especially in the regulated arena), coupled with an increased awareness of bridging finance as a possible funding solution amongst brokers and borrowers.
I predict a much stronger Q2 for completed bridging loans and expect there to be a more even split of reg V non-reg loans moving forward, coupled with increased demand for refurbishment finance.